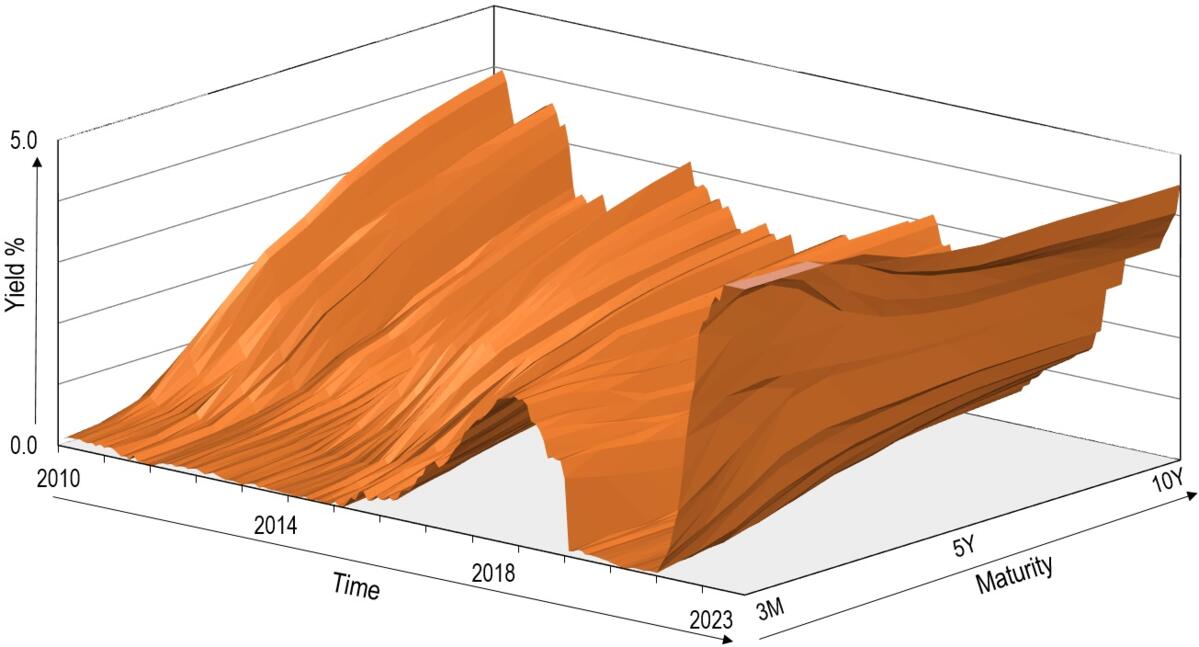
The fast and steep rise of interest rates in advanced economies over the last two years has surprised investors and economists reminding us of the need to approach yield curves' analysis with humility. Chart 1 shows the US yield curves since 2010 with the striking "tidal wave" profile of interest rates across all maturities, from short-term rates to the 10-year interest rate, beginning in 2022. Yield curves of other G10 countries follow similar patterns, with the exception of Japan, as the BoJ is keeping its short-term policy rate unchanged in negative territory.

Chart 1: US yield curves from January 2010 to October 2023.
Source: Bloomberg, MBaer's representation.
Many deep economic forces have driven interest rates up since 2022 and it is rather a question of what weight should be put on each of them. For starters, central banks' fight against inflation is obviously the factor behind the steep rise of short-term rates and one of the factors behind the increase of the long-term yields.
Short-term interest rates dynamics…
In 2023, the US federal funds rate reached 5.5%, after averaging just 0.5% from 2010 to 2021 (see Chart 1). Against the market consensus and the Fed's projections in 2022, we forecasted correctly that the Fed would raise interest rates up to 6%, as we argued the Fed had to act aggressively to bring inflation down and compensate for its policy, forecasting and communication errors. We have been proven right also on the ECB hiking cycle, as we expected the ECB reference rate to reach 4% by end-2023. We now expect the hiking cycle for major central banks, with the exception of the BoE, to be nearly over.
Now comes the hard part: assessing where the equilibrium level of interest rates, r*, will be over the next decade or so. Fed estimates of the nominal r* are at about 3%, close to the FOMC dot plot at 2.5%, and markets are currently pricing in a higher r*.
Our forecasting toolbox for G10 yield curves comprises a macro-yield model that combines interest rates with GDP growth and inflation (see Annex 1). For the US, our models' forecasts, the recent FOMC dot plot, r* estimates, the current market pricing and economists' surveys suggest the average level of short-term interest rates for the next decade will stay almost certainly well above the average of the short-term rates during the last decade. Our best guess is that US short-term interest rates will fluctuate within the 3.0% to 5.0% range for the next decade. The age of free money is over, irrespective of when major central banks will end hiking and whether or how quickly short-term rates will fall. This force will keep the tidal wave of rates high for longer.
…and the drivers of long-term bond yields
It is useful to look at long-term yields as a combination of expected short-term real interest rates, expected inflation and a term premium, which is the investors' reward for bearing interest rate risk. In essence, long-term bond yields can be decomposed into two parts: the investors' expected level of interest rates and the required term premium. Crucially, both components vary in time and are unobservable, so there is little agreement among investors, central bankers and academics on the respective size and impact of each component on long-term yields' levels and dynamics. The following facts on the term premium emerged from the ongoing debate[1]. The Fed's estimate of the US term premium has been on a downward trend and turned even negative since the 90s' until mid-2020, suggesting that a large portion of the decline in the US long-term yields over the same period can be ascribed to the fall in the term premium.
The secular forces driving the decline in the term premium are the low inflation risk premium and the safe-haven properties of the Treasuries, as the stock-bonds correlation turned negative at the beginning of the century. More recently, the Fed's quantitative easing (QE) and the forward guidance policies in the aftermath of the great financial crisis (GFC) pushed down Treasury yields and reduced the uncertainty about the projected path of short rates, which further compressed the term premium.
The downward trend in the term premium halted in the second half of 2020 and the term premium started rising since then, with an abrupt acceleration in May this year. Early last year, we correctly anticipated the sudden decompression of the term premium from its lows, as we expected a sharp increase of the inflation premium, an increase of the volatility of expected inflation and the Fed's aggressive hike cycle and quantitative tightening (QT) policy. For this reason, we remained strongly underweight bonds in our mandates until recently. As the Fed and other major central banks continue reducing the outsized balance sheets accumulated since the GFC and the US budget deficit is on track to be much bigger this year than last, the term premium is likely to revert to its long-term average of about 1.5%.
Bringing together our long-term scenario for the US interest rates between 3.0% and 5.0% and a term premium above 1.0%, we expect long-term interest rates to hover between 4% and 6% for long. Our model's forecasts (see Annex 1) are consistent with this scenario. The implication is that the cost of capital will be permanently higher than in the last decade. The big wave of interest rates is no ankle slappers.
Francesco Mandalà, PhD
[1]Already in 1970, the economist Ed Kane joked: "It is generally agreed that, coeteris paribus, the fertility of a field is roughly proportional to the quantity of manure that has been dumped upon it in the recent past. By this standard, the term structure of interest rates has become . . . an extraordinarily fertile field indeed."